
Hotel analytics: RevPAR, ADR, occupancy and profit on one screen
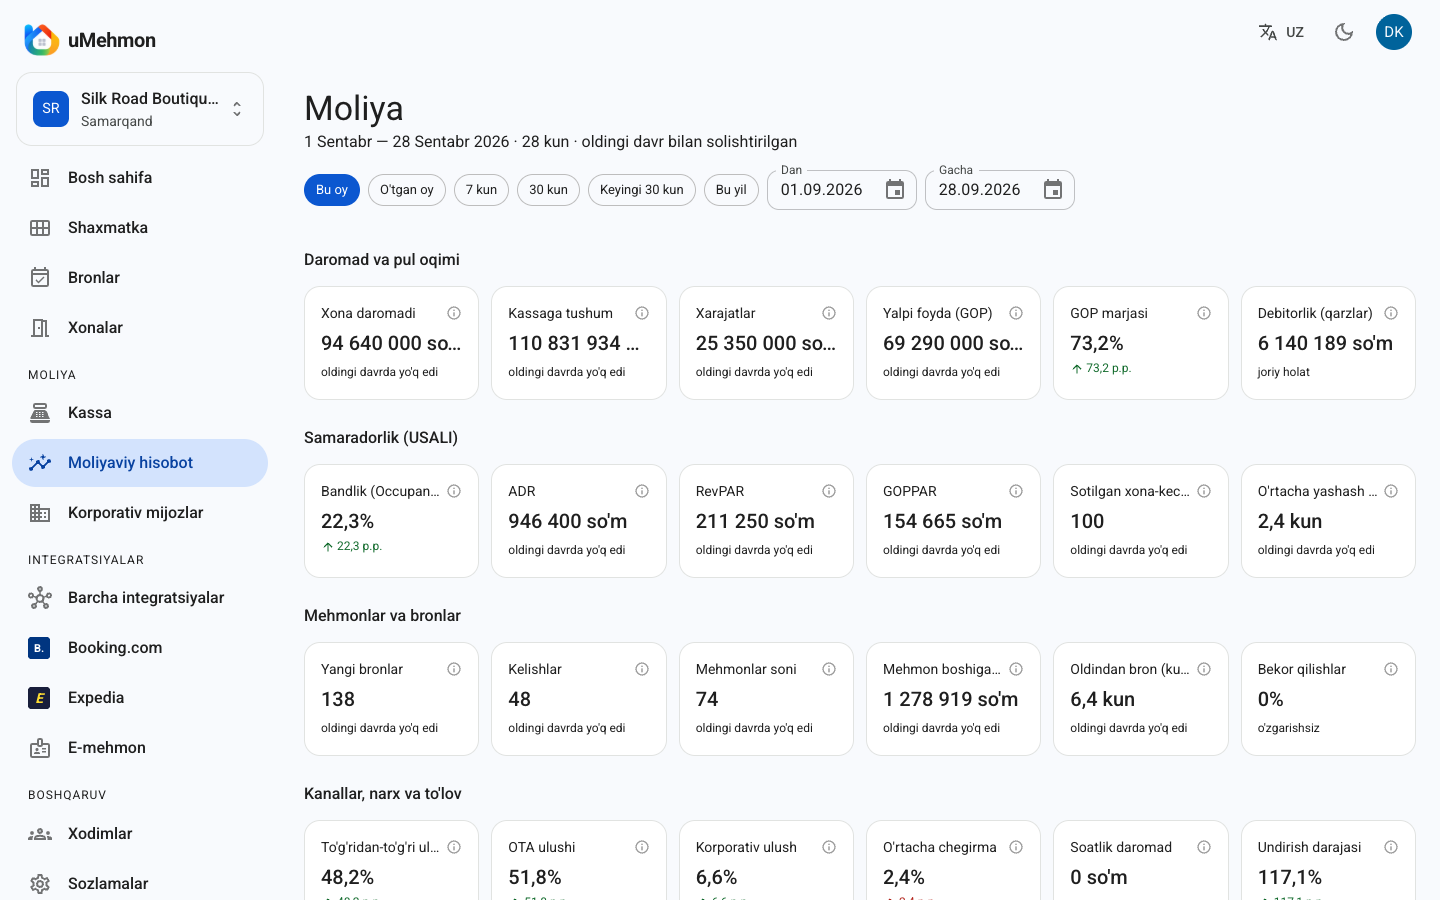
Short answer: hotel analytics turns booking, cash and expense data into KPIs such as occupancy, average daily rate (ADR), revenue per available room (RevPAR) and gross operating profit (GOP). uMehmon calculates more than 20 USALI-based KPIs automatically from live data in the system, compares them with the previous period and plots them on daily charts — no spreadsheets and no manual reports.
Why does a hotel need analytics?
Many owners run their hotel by asking "how much cash is in the drawer?" That is understandable, but not enough. The cash balance shows what came in today; it does not tell you how much each room earned this month, which channel is most profitable, or how much revenue discounts are eating.
Hotels have one defining feature: an unsold room night is gone forever. A room left empty tonight cannot be sold twice tomorrow. So the real question is not "how much money came in" but "how much of our available capacity did we turn into revenue?" That is exactly what RevPAR, occupancy and GOPPAR answer.
Analytics supports three core decisions: whether to raise or lower rates, which sales channel deserves more attention, and which costs can be cut.
What is USALI and why does it matter?
USALI (Uniform System of Accounts for the Lodging Industry) is the accounting and reporting standard widely used across the hospitality industry. It gives KPIs a shared meaning: when people say ADR, RevPAR or GOP, they mean the same formula.
uMehmon calculates its KPIs following this approach. That helps in two ways: you can discuss results in the industry's common language — with an investor, a bank or a management company — and the numbers are calculated by the same rules month after month, so they are genuinely comparable.
KPIs uMehmon calculates (with formulas)
The table lists the main KPIs in uMehmon's financial analysis and how each is calculated. All amounts are converted into the base currency. Room revenue is allocated to the nights that fall inside the selected period: if a booking crosses the period boundary, only the nights within the period are counted.
| KPI | Formula | Note |
|---|---|---|
| Room revenue | Booking value allocated to nights within the period | Earned revenue, not cash |
| Cash received | Sum of all payments in the period | Money actually collected |
| Expenses | Sum of expense transactions in the cash desk | Also shown by category |
| GOP | Room revenue − Expenses | Gross operating profit |
| GOP margin | GOP / Room revenue × 100% | Share of revenue kept as profit |
| Room nights sold | Occupied nights in the period | Bed nights in hostel mode |
| Available room nights | Active rooms × Days in period | Beds × days in hostel mode |
| Occupancy | Room nights sold / Available room nights × 100% | Capacity utilisation |
| ADR | Room revenue / Room nights sold | Average rate of a sold room |
| RevPAR | Room revenue / Available room nights | Revenue per available room |
| GOPPAR | GOP / Available room nights | Profit per available room |
| ALOS | Total nights of arrivals / Number of arrivals | Average length of stay |
| New bookings | Bookings created in the period | Demand trend |
| Arrivals | Bookings with check-in date in the period | Front-desk workload |
| Guests | Adults + children in arriving bookings | Actual guest flow |
| Revenue per guest | Room revenue / Guests | Value of one guest |
| Lead time | Average (Check-in date − Booking date), in days | Booking window |
| Cancellation rate | Cancelled bookings / New bookings × 100% | Booking quality |
| No-show rate | No-show bookings / New bookings × 100% | Share of no-shows |
| Direct share | (Direct + phone + walk-in revenue) / Room revenue × 100% | Commission-free revenue |
| OTA share | OTA booking revenue / Room revenue × 100% | Channel dependence |
| Corporate share | Company booking revenue / Room revenue × 100% | B2B share |
| Average discount | (List-rate total − Actual total) / List-rate total × 100% | Cost of discounting |
| Hourly revenue | Count and revenue of hourly (day-use) bookings | Extra revenue stream |
| Collection rate | Cash received / Room revenue × 100% | Share of earned revenue collected |
| Receivables | Unpaid balance on checked-in and checked-out bookings | What guests and companies owe |
The analysis section also includes daily charts (revenue, room nights, expenses, cash received, daily occupancy), revenue by source channel, revenue by room type, breakdowns by payment method and expense category, revenue by company, and a guest ledger showing total, paid and balance for every booking.
The core trio: occupancy, ADR and RevPAR
These three are linked: RevPAR = Occupancy × ADR. Read them together, never in isolation.
Example: a 20-room hotel in a 30-day month. Available room nights = 20 × 30 = 600. Room nights sold = 420. Room revenue = 168 million UZS.
- Occupancy = 420 / 600 × 100% = 70%
- ADR = 168,000,000 / 420 = 400,000 UZS
- RevPAR = 168,000,000 / 600 = 280,000 UZS (or 70% × 400,000)
Now compare two scenarios. Example A: you raise the rate to 450,000 UZS and occupancy falls to 60%. RevPAR = 60% × 450,000 = 270,000 UZS — ADR went up, RevPAR went down. Example B: you lower the rate to 380,000 UZS and occupancy rises to 78%. RevPAR = 78% × 380,000 = 296,400 UZS — a lower rate, but each available room earned more.
These examples only illustrate the arithmetic; real outcomes depend on your market and season. Go deeper with how to calculate RevPAR, what is ADR and what is hotel occupancy.
Accounting for seasonality
Seasonality is a strong factor for hotels in Uzbekistan and across Central Asia: tourist cities are busiest in spring and autumn, while holidays and events can shift demand sharply. Comparing this month only with last month can therefore mislead. In uMehmon you can select any period and compare it with the previous period of the same length; once you have more than a year of data, it is also worth reviewing the same period last year.
Why RevPAR is not enough: GOP and GOPPAR
RevPAR shows revenue but ignores costs. Two hotels can have the same RevPAR while one spends far more on OTA commissions and overheads. GOPPAR exposes that difference.
Example: the hotel above has monthly expenses of 100 million UZS. GOP = 168 − 100 = 68 million UZS. GOP margin = 68 / 168 × 100% ≈ 40.5%. GOPPAR = 68,000,000 / 600 ≈ 113,333 UZS.
In uMehmon expenses are posted through the cash desk by category, so when GOP drops you can see immediately which category grew.
What daily charts and revenue sources reveal
Monthly totals give the big picture, but problems often hide in individual days. uMehmon's daily charts show revenue, room nights sold, expenses, cash received and occupancy for every day. A month at 65% occupancy might turn out to be full weekends and half-empty weekdays — a signal to consider corporate offers or hourly bookings midweek.
The revenue sources view splits revenue by channel: direct, phone, walk-in and OTA. The room-type breakdown shows which category performs best, and the company breakdown shows which partner contributes most. Payment-method totals (cash in UZS and foreign currency, Uzcard, Humo, Visa, Mastercard, bank transfer) make cash handovers and bank reconciliation easier.
The guest ledger lists amount, paid and balance for each booking, so at month end you do not need a separate list to find out who still owes money.
What it takes for analytics you can trust
Any analytics is only as accurate as the data behind it. A few simple rules:
- Every booking goes into the system. Record phone bookings and friends-of-the-owner stays on the tape chart too, or occupancy will look lower than it is.
- Set the source correctly. Channel shares depend on it.
- Post expenses through the cash desk. Utilities, payroll, laundry, repairs — each with a category. Otherwise GOP will be overstated.
- Refresh exchange rates. One click updates Central Bank rates so foreign-currency bookings are valued correctly.
- Keep room inventory current. The number of active rooms sets available room nights.
Comparison: spreadsheets, basic reports and uMehmon analytics
| Criterion | Spreadsheet / manual | Basic software (booking list only) | uMehmon analytics |
|---|---|---|---|
| Data source | Copied by hand | Bookings only | Bookings, cash and expenses together |
| Occupancy, ADR, RevPAR | You write the formulas | Usually occupancy only | Automatic |
| GOP, GOPPAR | From separate accounting | Not available | Automatic from cash expenses |
| Channel and corporate share | Hard and error-prone | Rarely | Automatic |
| Previous-period comparison | Manual | Rarely | For every KPI |
| Currencies | Rates entered by hand | Often missing | Central Bank rates in one click |
| Update frequency | End of day or week | Varies | Real time |
| Error risk | High | Medium | Low (single source) |
Pros and cons
Pros
- More than 20 KPIs on one screen with no extra setup.
- Revenue is allocated by night, so bookings that span two months do not distort reports.
- Because analytics is tied to the cash desk and expenses, GOP and GOPPAR reflect real figures.
- Revenue sources by channel, company and room type are visible.
- Correct bed-based calculations in hostel mode.
- Automatic previous-period comparison and daily charts.
Cons and limitations
- No market benchmarking against competitors — only your own data.
- Automated dynamic pricing and AI forecasting are on the roadmap (AI for hotels).
- Analytics is only as complete as your data: if expenses are not posted, GOP is overstated.
- No custom report builder — the KPI set is fixed.
- The interface is currently in Uzbek and Russian; an English interface is not available yet.
Quick Q&A
Q: Why do cash received and room revenue differ? A: Room revenue is counted by nights stayed, cash by the day payment arrives. Prepayments and outstanding balances make them diverge, and the collection rate shows the gap.
Q: Do cancelled bookings count toward revenue? A: No. Revenue comes only from sold nights; cancellations are reported as a separate rate.
Q: Do rooms taken out of service affect occupancy? A: Capacity is based on active rooms, so keeping room statuses accurate in the system matters.
Q: Do hourly bookings distort ADR? A: Hourly booking count and revenue are reported as a separate KPI, so their impact is visible on its own.
How to use uMehmon analytics
1. Weekly check
Each week, compare occupancy, ADR and RevPAR with the previous week. If occupancy drops while ADR stays flat, demand has softened — review rates or channels.
2. Channel analysis
Watch direct and OTA shares. A high OTA share means commissions reduce GOP. The channel manager keeps availability in sync, while working directly with repeat guests and companies grows commission-free revenue.
3. Discount control
The average discount KPI shows the gap between list rate and actual amount. Combined with the rate range (min–max) and manager approval, it keeps discounting under control.
4. Lead time and cancellations
A short lead time means guests book at the last minute, so there is room to adjust rates later. A high cancellation rate is a reason to revisit your prepayment policy.
5. Monthly profit review
At month end, review GOP, GOP margin and GOPPAR, compare expense categories and check receivables. Balances owed by corporate accounts show up here too.
Who it is for
- Independent and boutique hotels where the owner wants to see the numbers directly.
- Hostels — with correct bed-night calculations (hostel management software).
- Multi-property owners — separate analytics for each property.
- Managers reporting to investors or banks — KPIs in USALI terms.
Pricing
| Plan | Price (per month) | Rooms | Staff | Analytics |
|---|---|---|---|---|
| Trial | 14 days free | up to 30 | — | Full |
| Start | 290,000 UZS | up to 10 | 2 | Full |
| Pro | 590,000 UZS | up to 40 | 10 | Full + OTA channels |
| Business | 990,000 UZS | up to 300 | 50 | Full + OTA channels |
Conclusion
Hotel analytics does not have to be a complex BI platform. What matters is that KPIs come from a single source, use the right formulas and update every day. uMehmon calculates occupancy, ADR, RevPAR, GOP, GOPPAR and more automatically from bookings, cash and expenses, compares them with the previous period and gives you clear numbers to act on. For the full platform, see hotel management software.
Start a 14-day free trial — sign up and see your hotel's real RevPAR within the first week.
How to set up hotel analytics in uMehmon
- 1
Sign up
Create an account at umehmon.uz/register and start the 14-day free trial.
- 2
Enter your room inventory
Add all active rooms (beds, for hostels) — occupancy and RevPAR are calculated from this capacity.
- 3
Keep every booking in the system
Record direct, phone, walk-in and OTA bookings with their source and, where relevant, the company.
- 4
Record cash and expenses
Post every payment and every expense with a category — GOP and GOPPAR are calculated from these.
- 5
Analyse a period
In the financial analysis section pick a period and review KPIs against the previous period and on daily charts.
- 6
Act and verify
Adjust rates, channels or costs, then check how RevPAR and GOPPAR changed in the next period.
Frequently asked questions
Hotel analytics is the calculation of key performance indicators such as occupancy, average daily rate, revenue per available room and profit from booking, cash and expense data. It gives owners a numerical basis for decisions on pricing, sales channels and costs.
RevPAR = room revenue / available room nights. For example, a 20-room hotel has 600 room nights in a 30-day month; with 180 million UZS in room revenue, RevPAR is 300,000 UZS. It also equals occupancy multiplied by ADR.
ADR is the average rate of rooms actually sold, while RevPAR also accounts for empty rooms. If you raise rates and lose occupancy, ADR goes up but RevPAR can go down.
Every KPI is calculated automatically from live data in the system: bookings, room inventory, cash transactions and expenses. There is no need to copy numbers into spreadsheets or build reports by hand.
In hostel mode capacity is measured in beds and the unit sold is a bed night. Occupancy, ADR and RevPAR are therefore calculated per bed.
Yes. Every KPI for the selected period is automatically compared with the previous period of the same length, so growth or decline is visible immediately.
Foreign-currency amounts are converted into the base currency. Central Bank exchange rates can be refreshed with one click, so bookings in USD, EUR or RUB flow correctly into the totals.
No. Automated dynamic pricing is on the roadmap. Analytics gives you the numbers for pricing decisions, and the rate range (min–max) controls how staff apply rates.
Try uMehmon free for 14 days
Tape chart, reservations, cash desk, E-mehmon and Booking.com — in one platform. No credit card required.
Start free trial